
papers.ssrn.com/sol3/papers.cfm?abstract_id=3561560
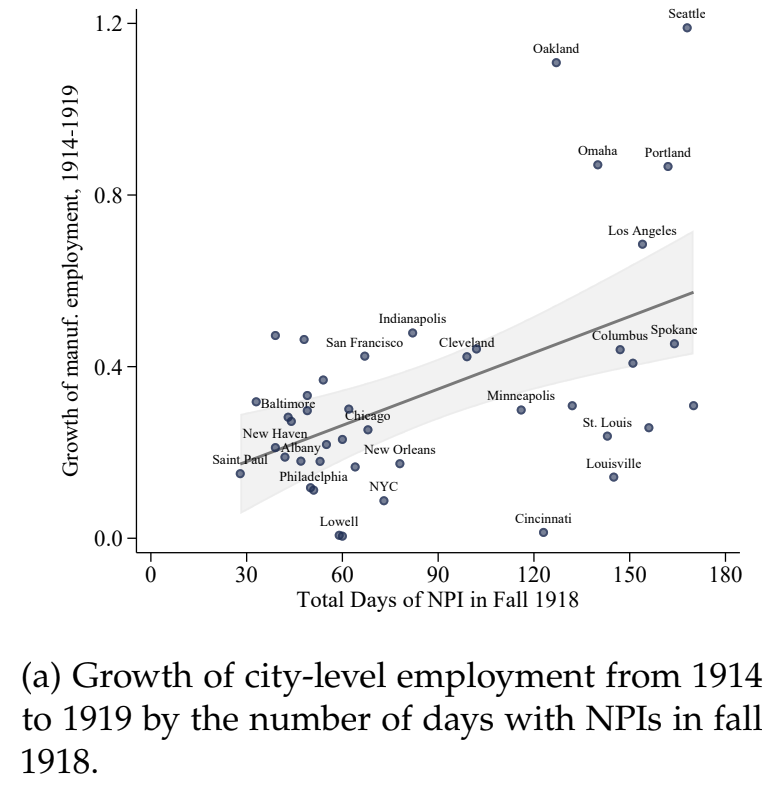
We find that cities that intervened earlier and more aggressively do not perform worse and, if anything, grow faster after the pandemic is over. Our findings thus indicate that NPIs not only lower mortality; they also mitigate the adverse economic consequences of a pandemic.
Matt’s note: a preliminary version of this paper (seeking comments) was released on March 26th that was used for the creation of this article.
The paper was published in full on June 6th, in which it re-affirmed its position as made in the March 26th preliminary publication.
The March 26th preliminary version has been replaced with the June 6th final publication for the preview above, but the original preliminary can be found here for comparison.
This paper examines the impact of 1918 Flu pandemic and resulting non-pharmaceutical interventions on real economic activity. Using variation across U.S. states and cities, we deliver two key messages.
First, the pandemic leads to a sharp and persistent fall in real economic activity. We find negative effects on manufacturing activity, the stock of durable goods, and bank assets, which suggests that the pandemic depresses economic activity through both supply and demand-side effects.
Second, cities that implemented more rapid and forceful non-pharmaceutical health interventions do not experience worse downturns.
In contrast, evidence on manufacturing activity and bank assets suggests that the economy performed better in areas with more aggressive NPIs after the pandemic.
Altogether, our evidence implies that pandemics are highly disruptive for economic activity. However, timely measures that can mitigate the severity of the pandemic can reduce the severity of the persistent economic downturn. That is, NPIs can reduce mortality while at the same time being economically beneficial.
![]()
More:
(Nature Research) Mobility network models of COVID-19 explain inequities and inform reopening
nature.com/articles/s41586-020-2923-3?T=AU
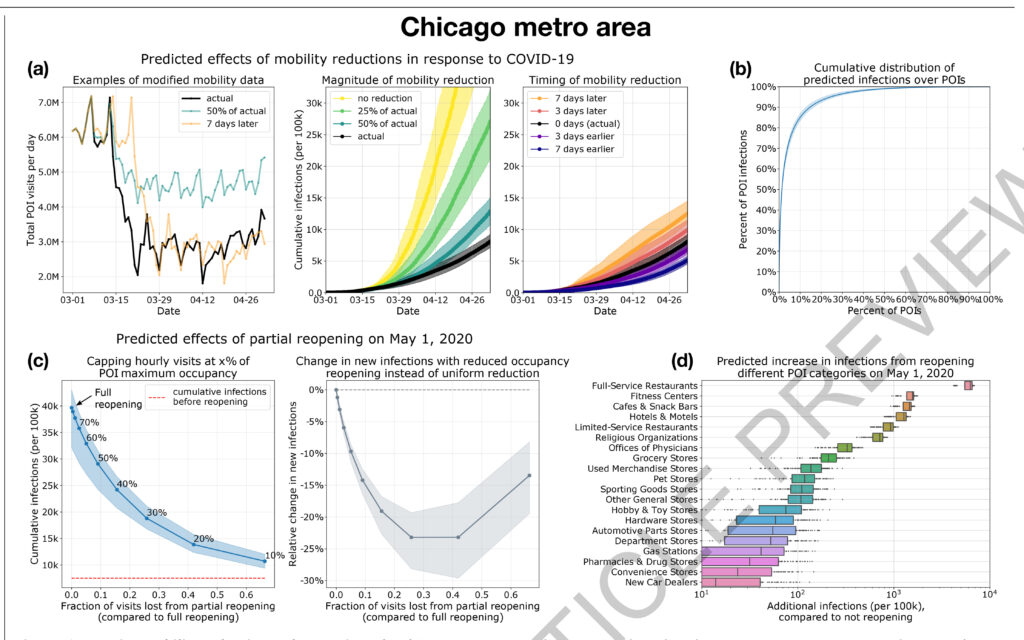
Derived from cell phone data, our mobility networks map the hourly movements of 98 million people from neighborhoods (census block groups, or CBGs) to points of interest (POIs) such as restaurants and religious establishments, connecting 57k CBGs to 553k POIs with 5.4 billion hourly edges. We show that by integrating these networks, a relatively simple SEIR model can accurately fit the real case trajectory, despite substantial changes in population behavior over time. Our model predicts that a small minority of “superspreader” POIs account for a large majority of infections and that restricting maximum occupancy at each POI is more effective than uniformly reducing mobility.
Matt’s Note:
Take note of the bar chart on the bottom right,
Its scale is exponential, meaning that items further right on the graph are modeled as spreading infection orders of magnitude more than those near the origin.
This may explain why these researchers’ model (based on rigorous use of cellphone data) suggests that targeted policies towards limiting infection spread at specific POI’s could have a profound impact in reducing the severity of the ongoing pandemic.
The Great Lockdown, despite its enormous short-term economic costs, has saved hundreds of thousands of lives.
International Monetary Fund
voxeu.org/article/coronavirus-meets-great-influenza-pandemic
Subscribe to be notified of new posts:

Mistakes were made. — Ronald Reagan