
(This is not financial advice. I have no idea what I’m talking about on this topic anyways.)
⚠️: This article reflects that Matt’s opinion aligns with the following author on seeking alpha, without a full pretense of certainty or full supported basis in readily observable facts as with other postings:
seekingalpha.com/article/4337130-stimulus-will-not-prevent-next-leg-down-in-u-s-stocks
Summary
- Fed and Treasury stimulus will not be able to prevent massive losses of income, production and wealth in the economy.
- Despite stimulus, vast numbers of businesses in high employment industries will disappear and/or take many years to recover.
- No V-Shaped recovery. It will take years for former levels of production to be reestablished in many industries. It will take nearly a decade for a return to full employment.
- There’s no free lunch. Massive increases in public and private debt burdens will impose enormous impediments on future growth.
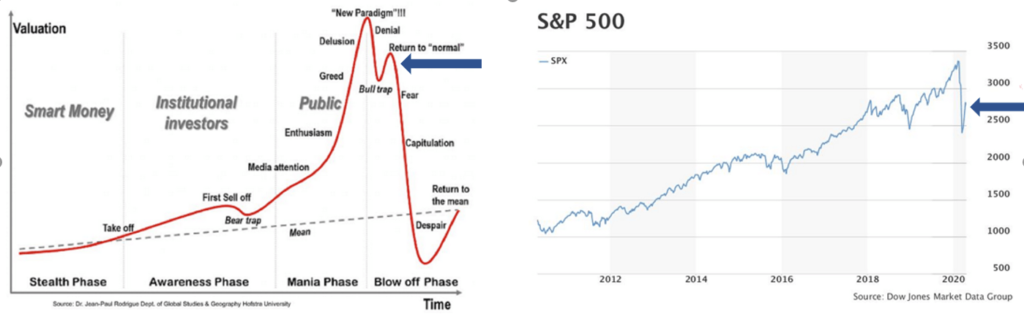
Since the recent low of 2237.40 registered on March 23, the S&P 500 index has staged a major counter-trend rally gain of 24.69%, as of April 9. This includes a gain of 11.23% in the past week. Although there were several technical factors and news catalysts that have contributed to this massive counter-trend rally, perhaps the most important critical factor has been expectations and announcements regarding unprecedented measures by the US Treasury and the US Federal Reserve to inject massive amounts of fiscal and monetary stimulus into the US economy and financial markets.
In this article I will explain why the combined measures by the US Treasury and Fed will not be enough to prevent massive and long-lasting losses of national income, production and wealth. In particular, I will show that in the context of their inability to prevent a massive and prolonged economic crisis that will extend well into 2021, US Treasury and Fed stimulus measures will not ultimately prevent the occurrence of another massive leg down in US equities. Indeed, after the current counter-trend rally fizzles out and the primary bear market trend resumes, in the course of the next leg down, US equity prices will collapse significantly below recent lows and establish a bottom somewhere between the range of approximately 1900 and 1500 on the S&P 500 index. The eventual recovery from this intermediate-term bottom will most likely be prolonged and painful (as opposed to V-shaped), with potential – depending on various developments – for occurrence of yet another major leg down to even lower levels.
The Economic Backdrop
The Unites States is barely in the initial stages of one of the most devastating economic crises in the nation’s history. Certainly, the forthcoming economic crisis will the most severe since the Great Depression…
seekingalpha.com/article/4337130-stimulus-will-not-prevent-next-leg-down-in-u-s-stocks
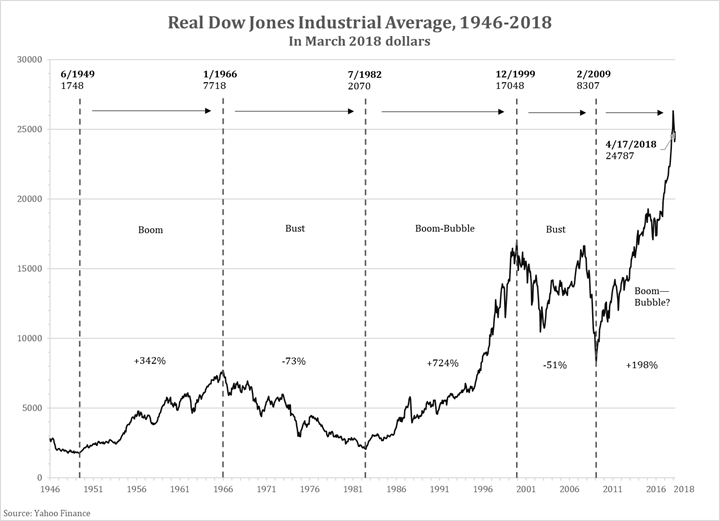
Others: Nasdaq 100 (NDX), Wilshire 5000
![]()
Matt’s opinion:
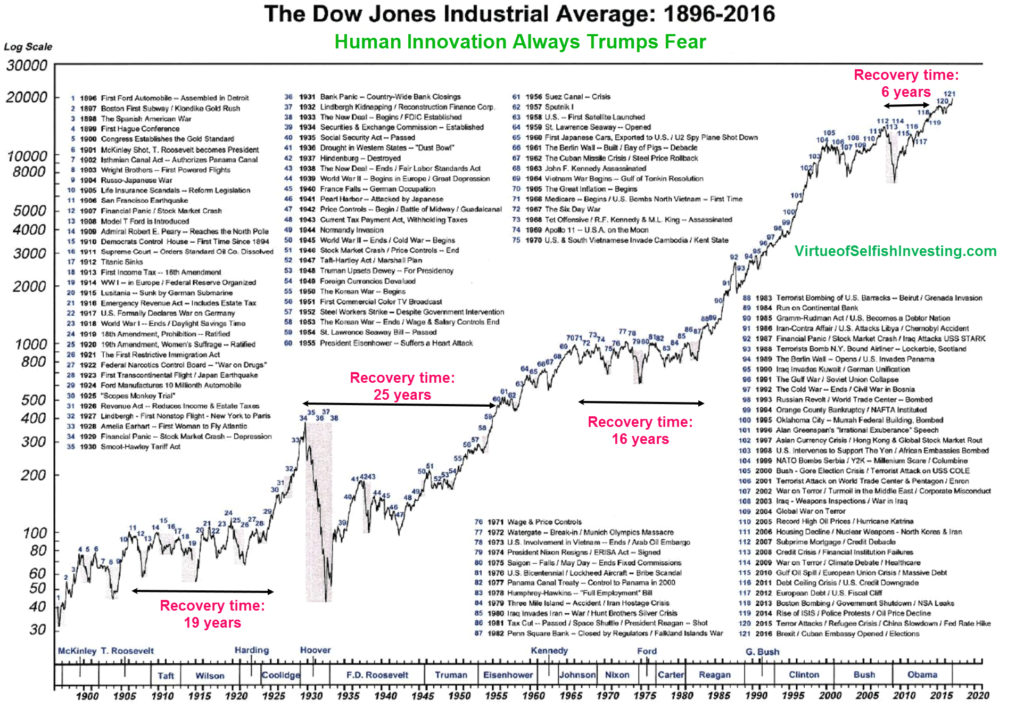
The Great Depression was started by a myriad of issues, but among those:
A runaway equities bubble due to even common folk trading on margin (loans)
Federal reserve interest rates were hiked up at the absolute worst time (borrowing more expensive)
Massive crop failure due to the Dust Bowl effect
(36) Nationwide run on the banks vastly and quickly reducing the money supply
And of course, (35) the devastating Smoot–Hawley tariff act, to which some have compared Trump’s
recent protectionary tariffs
(A ludicrous bill where every state tacked on “me too” tariffs for their particular industry,
the sum of which devastated the entire economy)
[Congress soon after forbade themselves from being able to pass tariffs, “like a kid in a candy store”,
hence why the presidential executive branch controls them]
“”What If?””
This is one dangerous rally:
https://seekingalpha.com/article/4340363-this-is-one-dangerous-rally
What’s not to like about this fabulous rally?
First, let us get our numbers straight. Someone told me the market declined 35% but already was up 25% so it’s now really only down 9%, barely enough to call it a correction.
I know that most SA readers are experienced enough to know this is not quite accurate. I told this gentlemen what you would expect: “If you have $100 invested in something and it declines 34%, how many ‘dollars’ does that leave you with?”
“$66.”
“And what does a 25% rally take you back to?”
“Is this a trick question? $66 plus $25 is $91. Like I said, just down 9%.”
“Not exactly. Since you only have $66 remaining, the 25% rebound is on $66, not $100. Therefore 25% of $66 is $16.50, so you have rebounded to $82.50.”
He eyed me skeptically and said, “You Wall Street guys can twist anything around.”
For the record, I’m not a Wall Street guy. I run my business from the shores of Lake Tahoe in the no income tax, more ranchers than gamblers corner of Nevada, a state where our legislature meets only every other year. The skeleton in my closet demands I tell you I once did work on Wall Street but got out of there as soon as I could.
My biggest concern about this rally: It has little support beyond what was being supported before the decline. Let me explain.
Leadership before the decline rested with the FANGMAN stocks. Leadership in this rally out of the decline has been the same. Investors did not take the time or give the attention to those fine companies that might have gotten ahead of themselves in price prior to the decline and now provide the opportunity to diversify away from FANGMAN with perhaps a greater capital gain potential. Nope, many are sticking with what worked before, ever and always.
That may yet prove to be a brilliant move, but there are those of us who see the rush back to FANGMAN as reminiscent of the Nifty Fifty of the 70s. This was a period in which the leadership got narrower and narrower until institutions and individuals alike were pretty much buying the same thing – only the 50 anointed companies seen as being the biggest and the best.
That did not end well. When the armor cracked, as it always will in one place or another, the rush to exit was brutal.
Buffett’s advice in general: forget the pundits (like me), charts and the manic depressive traders, buy (not necessarily now, but you’re free to if you want!) a cross-section of America (i.e. stock in solid businesses through ETF’s, etc.) and forget about it [very long term]:
(May 2nd)
From Berkshire Hathaway (NYSE:BRK) 2020 Annual Meeting
Anomalies in Buffet’s trading behavior?
(August 28th)
Breaking down Buffett’s comments at Berkshire Hathaway 2020 Shareholder’s meeting:
(May 2nd)
From Berkshire Hathaway (NYSE:BRK) 2020 Annual Meeting
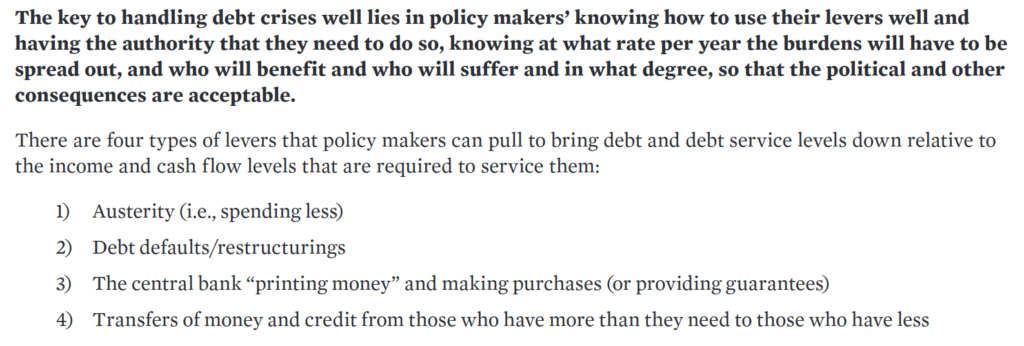
Big debt crises:
linkedin.com/posts/activity-6664164055642591234-fjAM
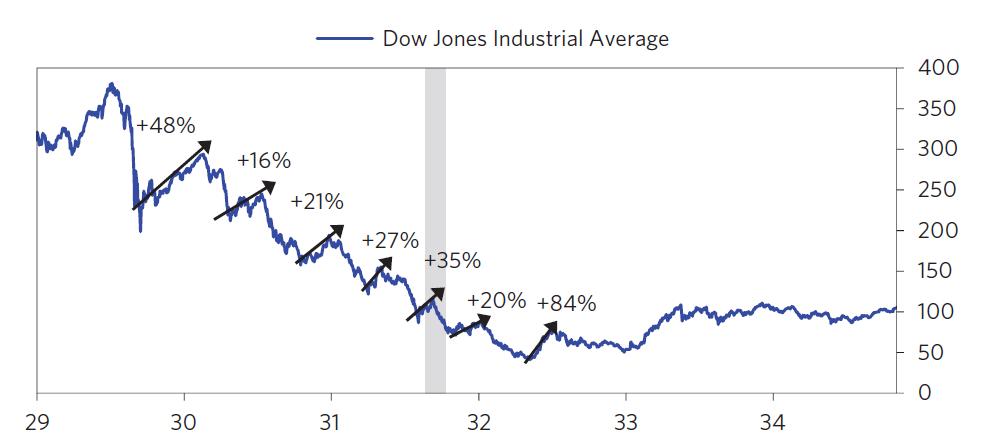
For those of you who have not read “Principles For Navigating Big Debt Crisis” by Ray Dalio, I highly recommend it. Especially the section on the 1930’s. Below is a snippet from his book showing the sharp rallies we had in the early 1930’s. Each one fueled by optimism on stimulus and the “worst is over” narrative.
LinkedIn via John Knott
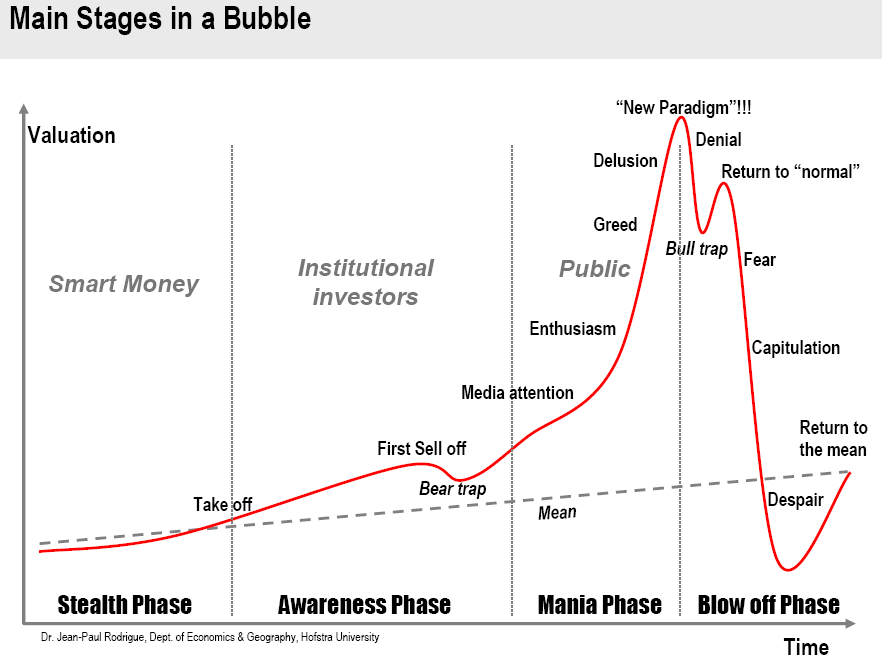
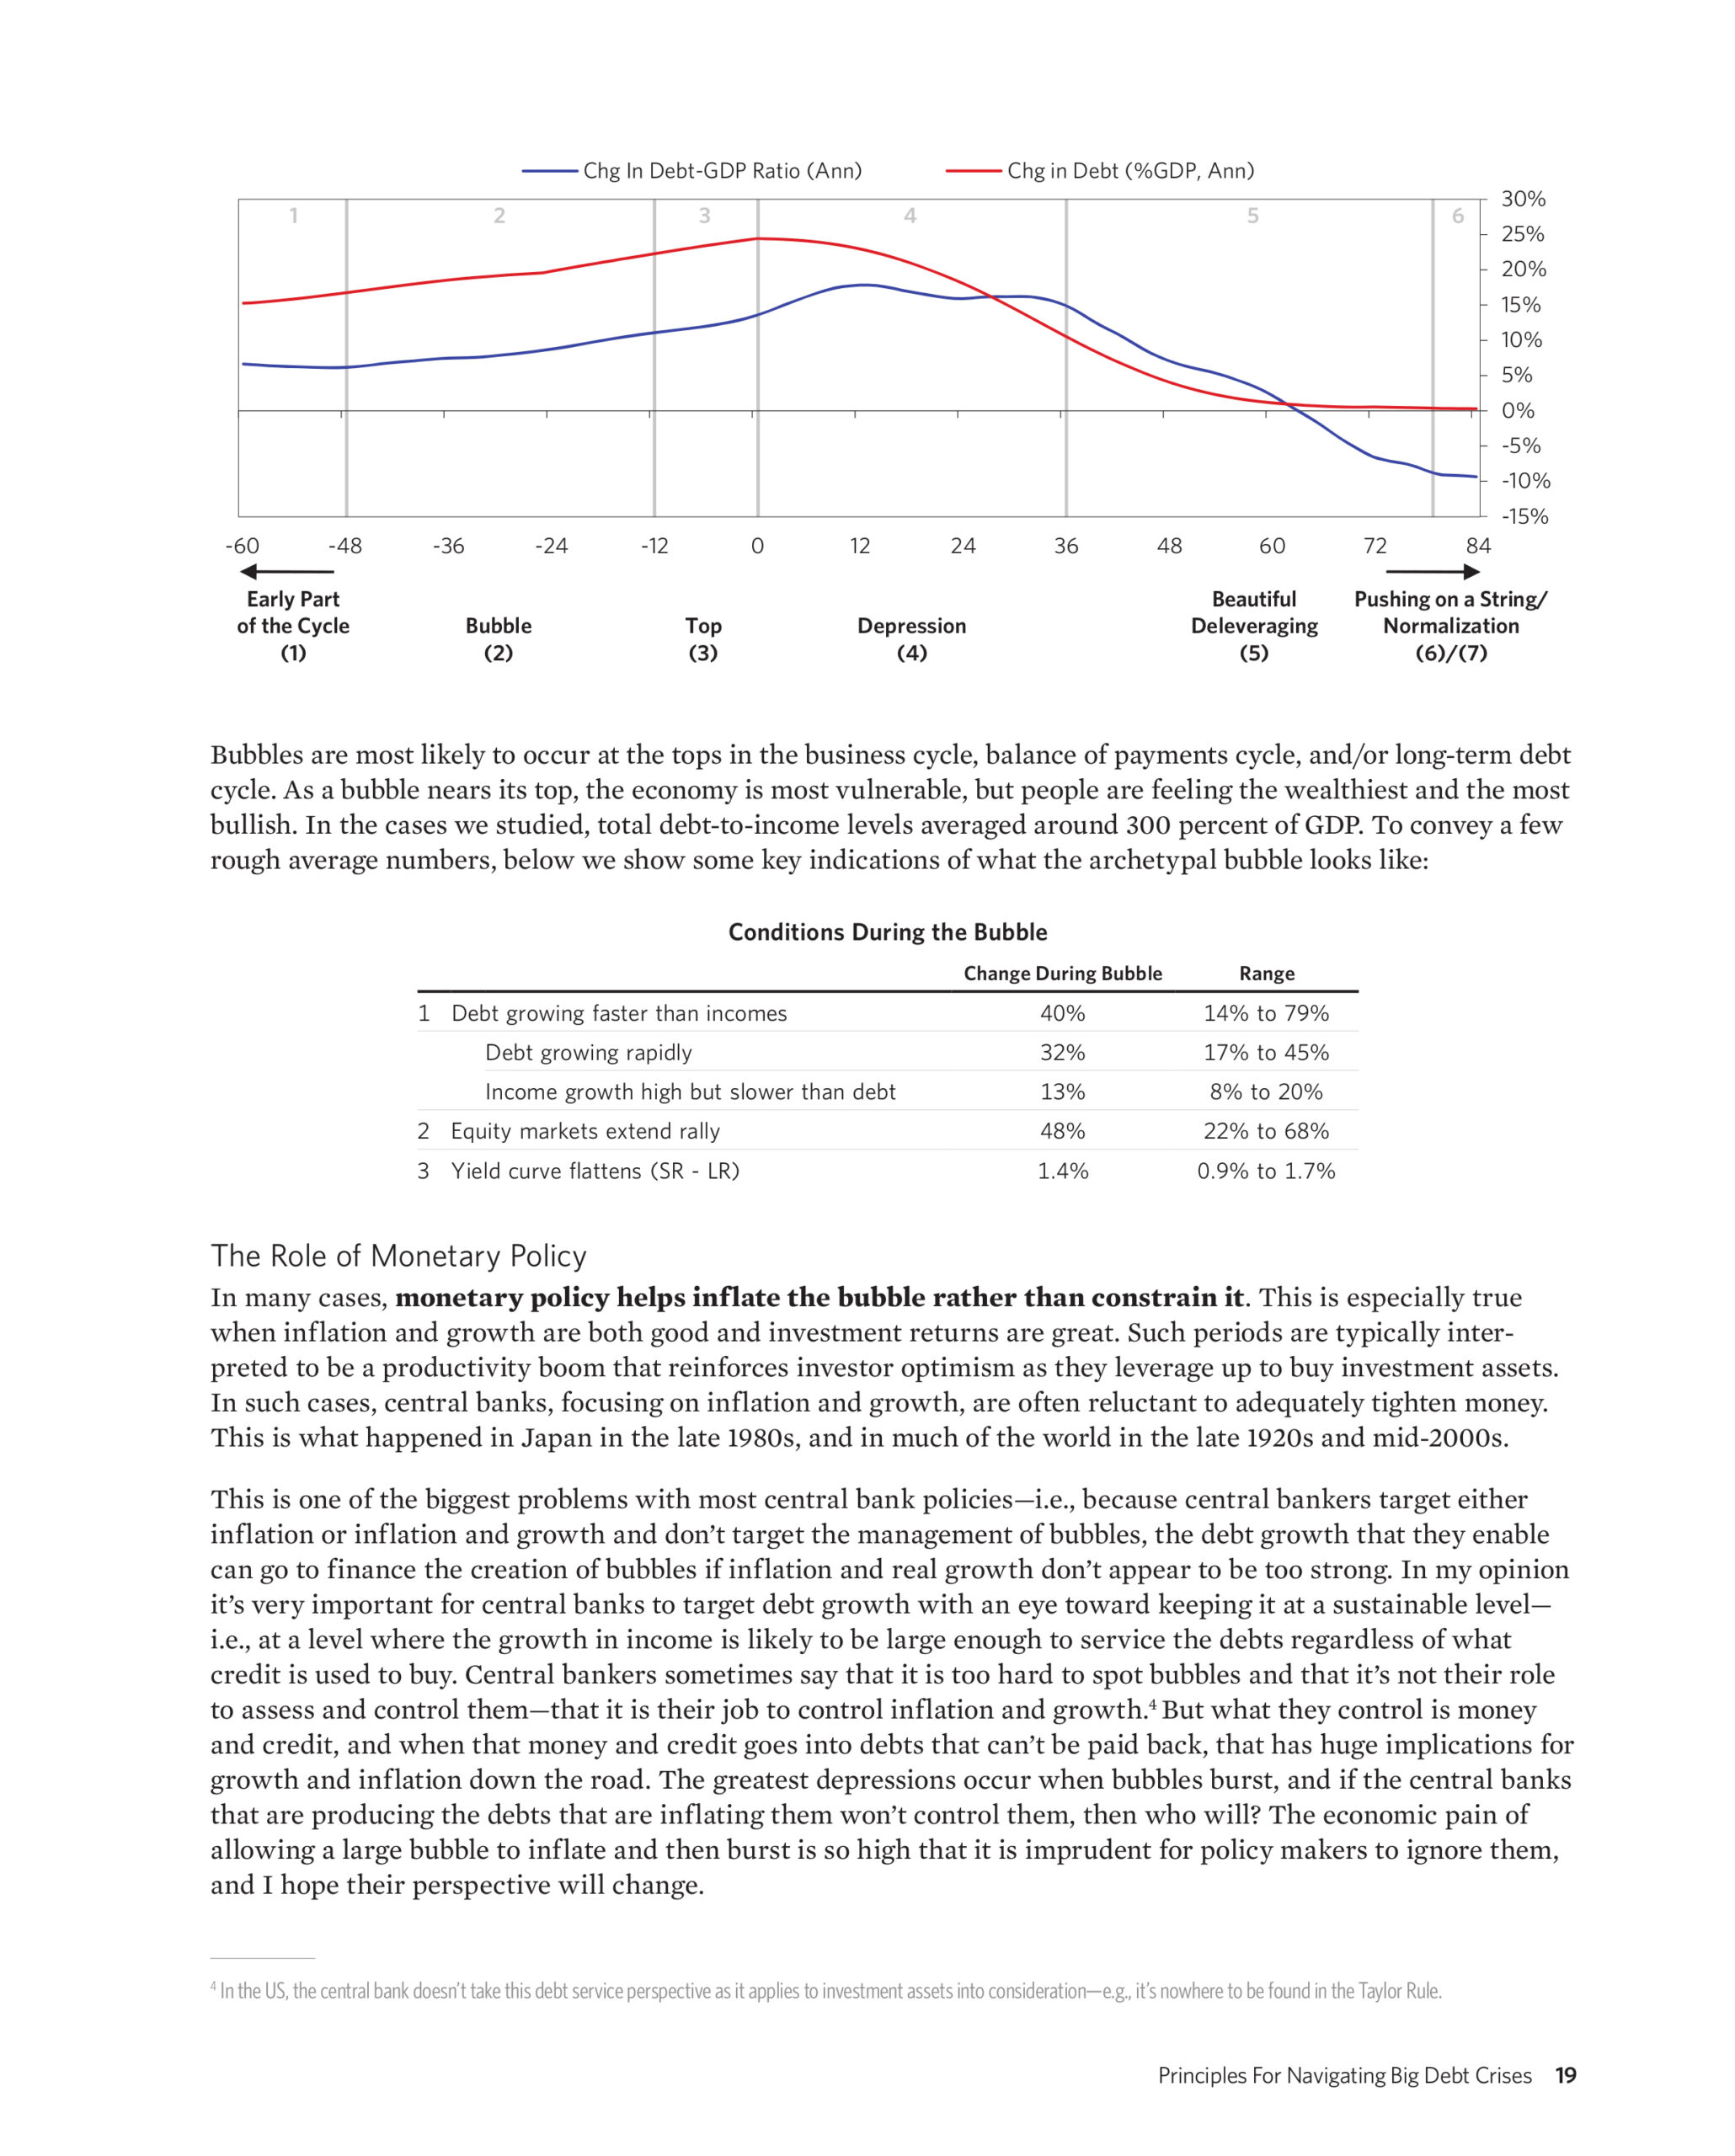
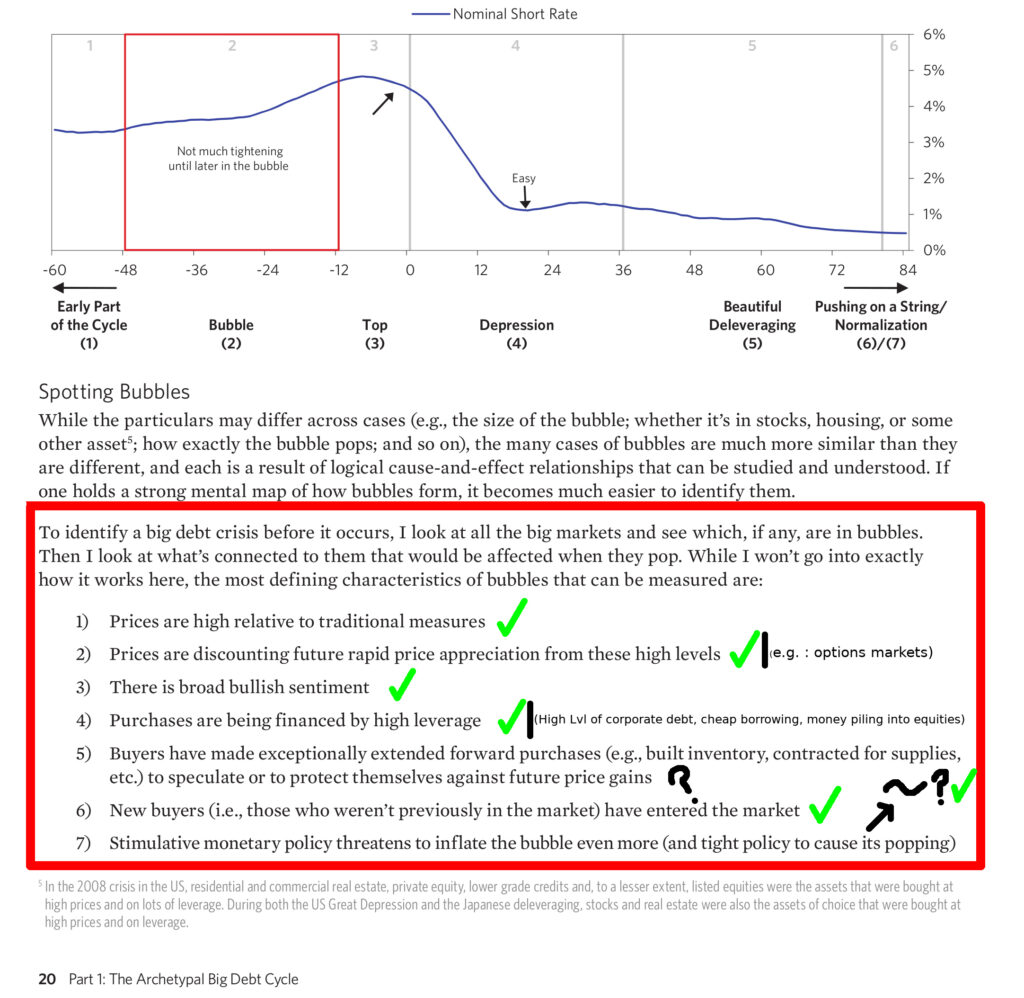
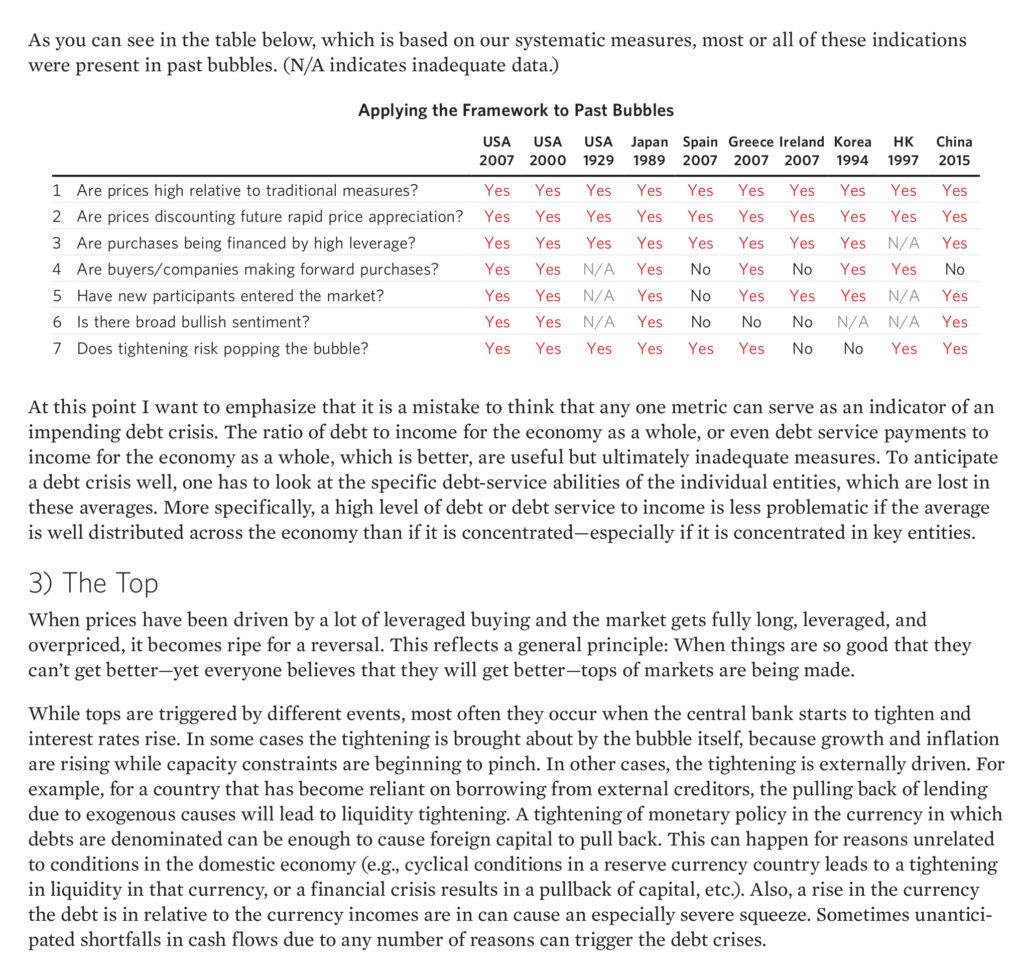
Bubbles are most likely to occur at the tops in the business cycle, balance of payments cycle, and/or long-term debt cycle. As the bubble nears its top, the economy is most vulnerable, but people are feeling the wealthiest and the most bullish.
…
In many cases, monetary policy helps inflate the bubble rather than constrain it
Principles For Navigating Big Debt Crises pg. 19
Typically debt crises occur because debt and debt service costs rise faster than the incomes that are needed to
Principles For Navigating Big Debt Crises pg. 13
service them, causing a deleveraging. While the central bank can alleviate typical debt crises by lowering real
and nominal interest rates, severe debt crises (i.e., depressions) occur when this is no longer possible
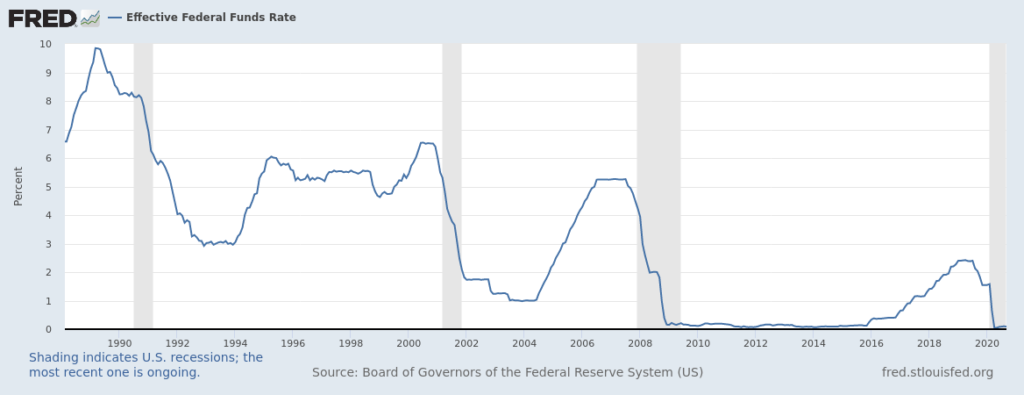
via Federal Reserve Bank of St. Louis
Captured 2020-10-23
In the immediate post-bubble period, the wealth effect of asset price movements has a bigger impact on economic growth rates than monetary policy does. People tend to underestimate the size of this effect. In the early stages of a bubble bursting, when stock prices fall and earnings have not yet declined, people mistakenly judge the decline to be a buying opportunity and find stocks cheap in relation to both past earnings and expected earnings, failing to account for the amount of decline in earnings that is likely to result from what’s to come. But the reversal is self-reinforcing.
Principles for Navigating Big Debt Crises Pg. 23
Some people mistakenly think that depressions are psychological: that investors move their money from riskier investments to safer ones (e.g., from stocks and high-yield lending to government bonds and cash) because they’re scared, and that the economy will be restored if they can only be coaxed into moving their money back into riskier investments.
This is wrong for two reasons: First, contrary to popular belief, the deleveraging dynamic is not primarily psychological. It is mostly driven by the supply and demand of, and the relationships between, credit, money, and goods and services—though psychology of course also does have an effect, especially in regard to the various players’ liquidity positions. Still, if everyone went to sleep and woke up with no memory of what had happened, we would be in the same position, because debtors’ obligations to deliver money would be too large relative to the money they are taking in. The government would still be faced with the same choices that would have the same consequences, and so on.
Principles for Navigating Big Debt Crises Pg. 25
IMF: worst downturn since great depression
Previously:
More:
Subscribe:

This is One Dangerous Rally:
https://seekingalpha.com/article/4340363-this-is-one-dangerous-rally