economicgreenfield.com/2020/03/23/the-u-s-economic-situation-march-23-2020-update/
Matt’s note: I don’t know what to make of this. I think his assessment is interesting, at the very least.
Certainly, Ted’s reflection on the prior existence of asset bubbles due to perpetually low interest rates and quantitative easing (QE) from central banks, despite said banks unwillingness to acknowledge their existence (+) is inspired, and I foresee as it as a prediction that will stand favorably against the test of time.
Perhaps the main reason that I write of our economic situation is that I continue to believe, based upon various analyses, that our economic situation is in many ways misunderstood. While no one likes to contemplate a future rife with economic adversity, current and future economic problems must be properly recognized and rectified if high-quality, sustainable long-term economic vitality is to be realized.
There are an array of indications and other “warning signs” – many readily apparent – that current economic activity and financial market performance is accompanied by exceedingly perilous dynamics.
I have written extensively about this peril, including in the following:
“Building Financial Danger” (ongoing updates)
“A Special Note On Our Economic Situation”
“Forewarning Pronounced Economic Weakness”
“Thoughts Concerning The Next Financial Crisis”
“Was A Depression Successfully Avoided?”
“Has the Financial System Strengthened Since the Financial Crisis?”
“The Next Crash And Its Significance”
My analyses continues to indicate that the growing level of financial danger will lead to the next stock market crash that will also involve (as seen in 2008) various other markets as well. Key attributes of this next crash is its outsized magnitude (when viewed from an ultra-long term historical perspective) and the resulting economic impact. This next financial crash is of tremendous concern, as my analyses indicate it will lead to a Super Depression – i.e. an economy characterized by deeply embedded, highly complex, and difficult-to-solve problems.
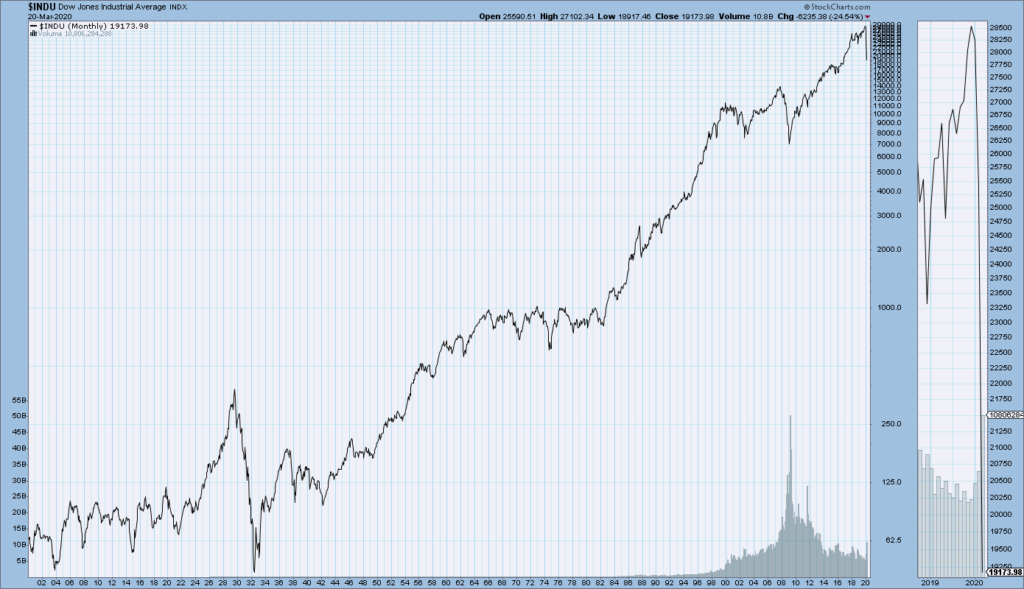
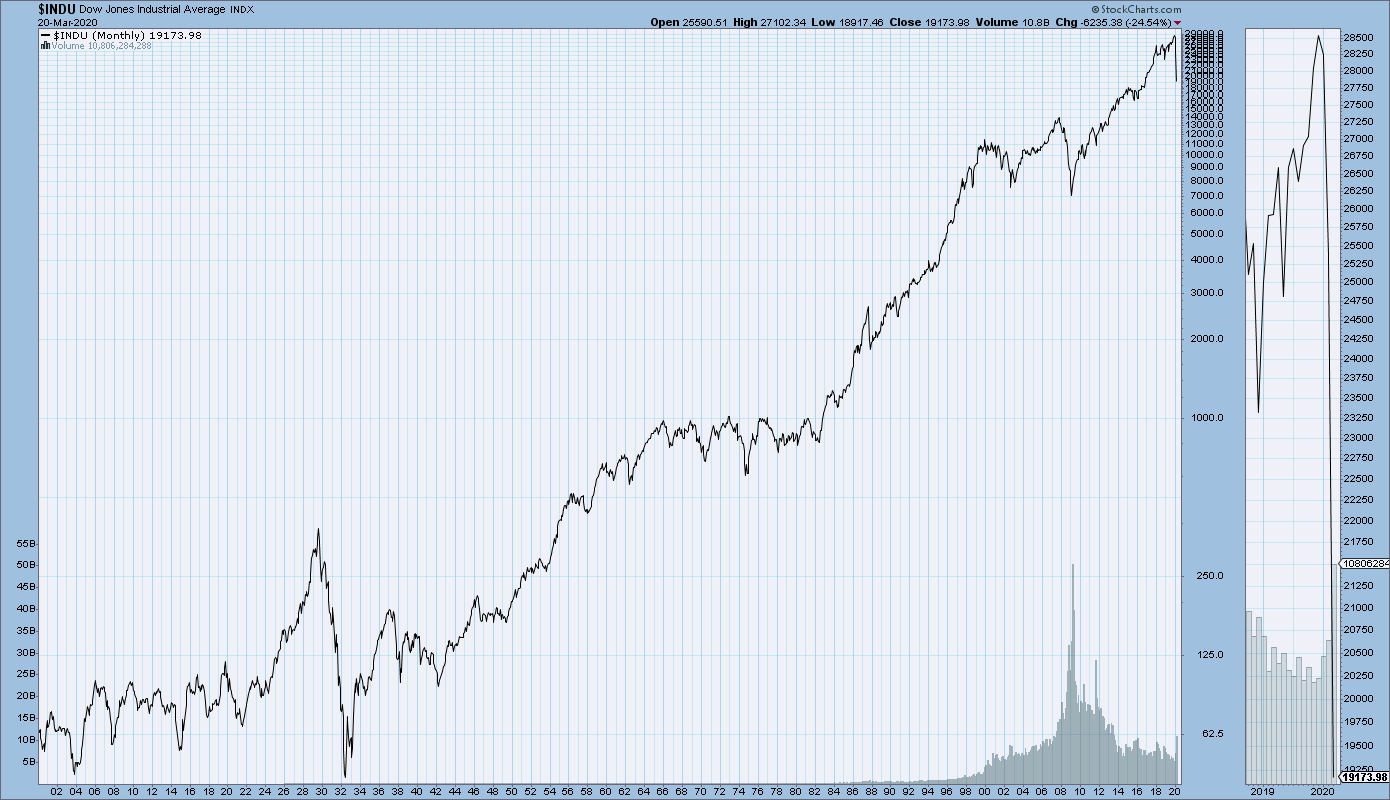
For long-term reference purposes, here is a chart of the Dow Jones Industrial Average since 1900, depicted on a monthly basis using a LOG scale (updated through March 20, 2020, with a last value of 19173.98):

![]()


