Tell all the people that you see
Follow me,
Follow me down
![]()
Previously:

I have written extensively about the stock market bubble, due to its magnitude, duration, and future financial and economic implications. My analyses (as this is written on February 23, 2020, with the S&P500 at 3337.75) indicate that the stock market bubble is simply enormous in size, by far the largest stock market bubble ever experienced in the United States. It may even be the largest bubble of any type in history. Of note, as I have mentioned frequently, there are many other immensely large asset bubbles currently in existence, perhaps most notably the bond market bubble
…
I have written extensively about the damage the “popping” or “bursting” of this current stock market bubble will cause. My analyses indicate that severe economic weakness will accompany the demise of the bubble. There are many reasons for this conclusion. One reason is that due to the exorbitant size of this stock market bubble, any significant, lasting drop in stock prices will result in a decline in many trillions of dollars in assets. Such a large decline in assets, via the (inverse) wealth effect, will have a marked economic impact in spending and confidence. As well, the stock market bubble has had many other notable direct and indirect effects. The demise of the bubble will have many other problematical impacts, including those on cost of capital and capital availability.
Also, as extensively discussed on this site, there are many current signs of economic weakness (weak economic growth or economic contraction) as well as outright (gravely) problematical economic conditions. Given such conditions, any pronounced economic or financial “shock” will have an outsized economic impact given the current economic state.
![]()
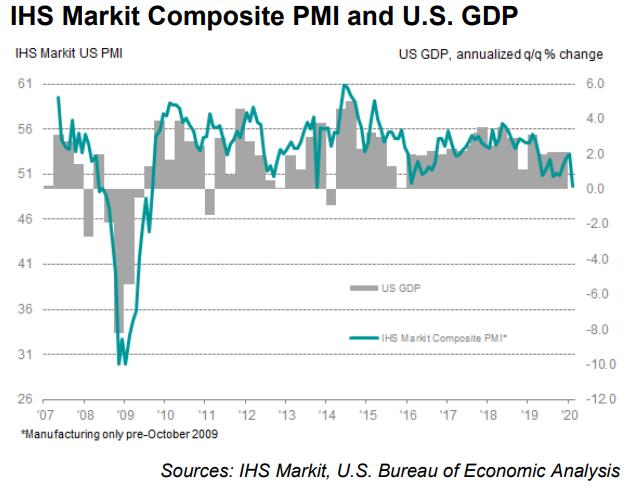
New data from IHS Markit today showed the first contraction in private sector business activity since Oct 2013, driven largely by a slowdown in services. Services have been underpinning job growth during this recovery so any slowdown would be concerning. And there have been other cracks showing: #JOLTS this month reported a decline of almost 1 million job openings YoY for services alone in Dec 2019. The JOLTS data is from *before* the coronavirus outbreak (which is likely to be an additional drag), indicating that this slowdown can’t just be chalked up to the outbreak. And indeed, while IHS respondents reported concerns about the coronavirus, they also cited general economic & political uncertainty as drivers of reduced activity.
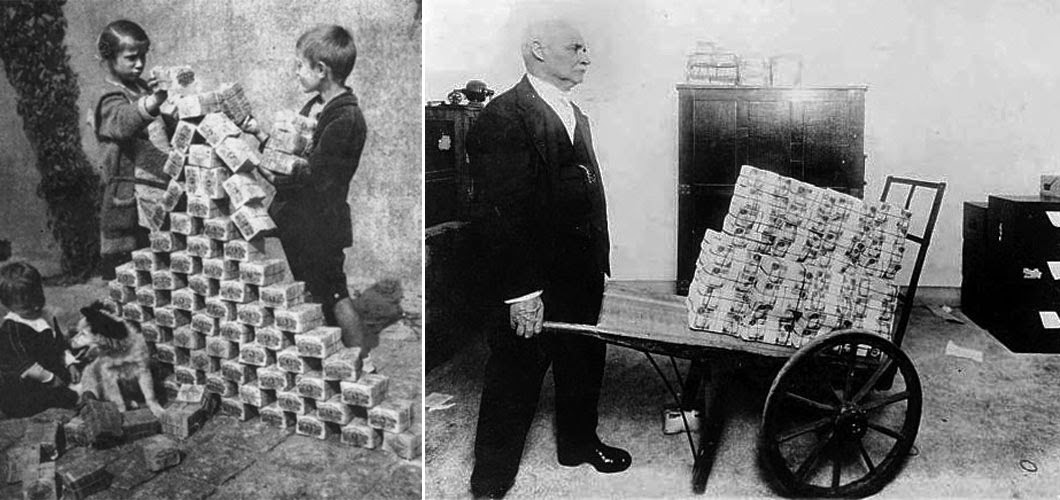
In 2010, in the wake of the global banking crisis, 34 of the world’s richest nations – those that belong to the Organisation for Economic Cooperation & Development (OECD) – ramped up their borrowing to $10.9 trillion. In 2019, the OECD revealed last week, those same governments took their borrowing to a fresh high of $11.4tn.
…
And those fears don’t stop at government debt. The OECD has spent the past couple of years warning about the colossal sums that corporations have borrowed.
In a separate assessment last week, it said non-financial businesses – that is, those outside the banking and insurance sector – issued $2.1tn in bonds. This is borrowing in addition to the overdraft facilities and bank loans these companies use to fund their activities.
“”Compared with previous credit cycles, today’s stock of outstanding corporate bonds has lower overall credit quality, higher payback requirements, longer maturities and inferior covenant protection. These are features that may amplify the negative effects that an economic downturn would have on the non-financial corporate sector and the overall economy.””
![]()
this is not financial advice
*I have no idea what I’m talking about
MIT Sloan Research Paper No. 5908-20
State Street Global Markets
Massachusetts Institute of Technology (MIT) – Sloan School of Management
State Street Associates
Date Written: January 15, 2020
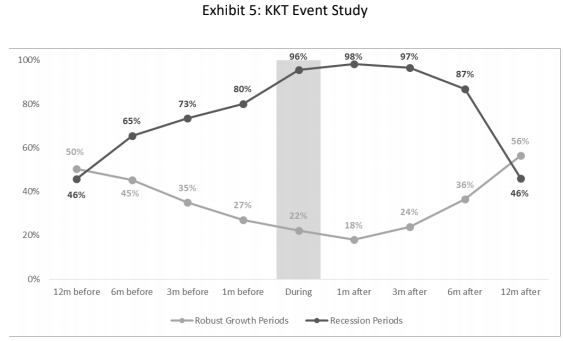
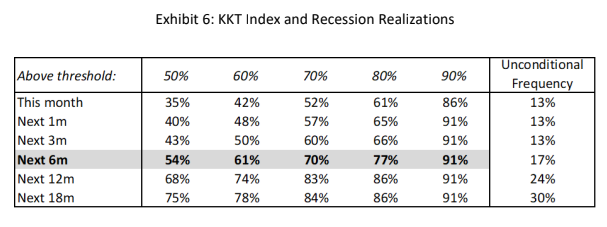
The authors introduce a new index of the business cycle that uses the Mahalanobis distance to measure the statistical similarity of current economic conditions to past episodes of recession and robust growth. Their index has several important features that distinguish it from the Conference Board’s leading, coincident, and lagging indicators. It is efficient because as a single index it conveys reliable information about the path of the business cycle. Their index gives an independent assessment of the state of the economy because it is constructed from variables that are different than those used by the NBER to identify recessions. It is strictly data driven; hence, it is unaffected by human bias or persuasion. It gives an objective assessment of the business cycle because it is expressed in units of statistical likelihood. And it explicitly accounts for the interaction, along with the level, of the economic variables from which it is constructed.
Exhibit 2 presents a time series of our index of the business cycle (solid black line),
which we refer to as the KKT Index, beginning in January 1956 and ending in November 2019 (the period for which all observations are out of sample). This line measures how much more likely it is that the conditions at any point in time are associated with recession instead of with robust growth. The periods defined as recessions by the NBER are indicated by the shaded bars.As of November 2019, the value of the KKT index was 76% (left axis), which means that
considering either recession or robust growth, this set of conditions is more closely associated with recession 76% of the time (and with robust growth 24% of the time). Put differently, a recession is more than three times as likely as robust growth.An index level of 76% does not necessarily mean that the economy is currently in recession. Rather, we should interpret it as an indication of the potential for the economy to enter recession in the foreseeable future.
Given historical guidance, the index should be close to 100% when a recession is imminent or underway.

![]()
In my 2010 book, Crisis Economics, I defined financial crises not as the “black swan” events that Nassim Nicholas Taleb described in his eponymous bestseller but as “white swans”. According to Taleb, black swans are events that emerge unpredictably, like a tornado, from a fat-tailed statistical distribution. But I argued that financial crises, at least, are more like hurricanes: they are the predictable result of builtup economic and financial vulnerabilities and policy mistakes.
There are times when we should expect the system to reach a tipping point – the “Minsky Moment” – when a boom and a bubble turn into a crash and a bust. Such events are not about the “unknown unknowns” but rather the “known unknowns”.
Beyond the usual economic and policy risks that most financial analysts worry about, a number of potentially seismic white swans are visible on the horizon this year. Any of them could trigger severe economic, financial, political and geopolitical disturbances unlike anything since the 2008 crisis.
![]()
this is not financial advice
*I also have no idea what I’m talking about
So in march 13th when it’s announced that Japan has entered a recession, the NASDAQ slips, suffering it’s fourth largest loss up to that point. It’s enough to spook investors, and get them questioning whether their companies can survive without their cheap capital.
The answer? No, not really.
As the taps turn off, dotcoms find themselves burning through cash. As promised profits fail to materialize, things turn from Mama Mia to Red Wedding real quick
currentmarketvaluation.com/models/buffett-indicator.php
gurufocus.com/stock-market-valuations.php

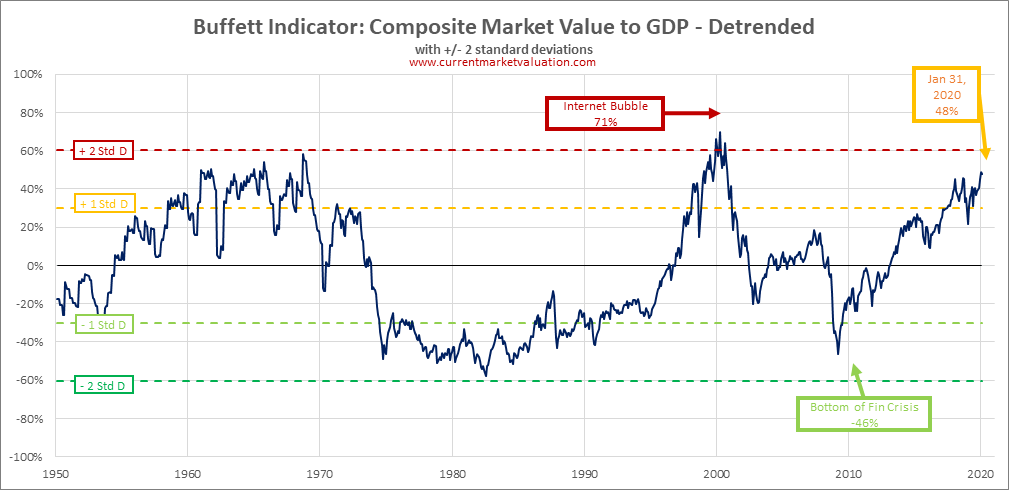
Over the long run, stock market valuation reverts to its mean. A higher current valuation certainly correlates with lower long-term returns in the future. On the other hand, a lower current valuation level correlates with a higher long-term return. The total market valuation is measured by the ratio of total market cap (TMC) to GNP — the equation representing Warren Buffett’s “best single measure”. This ratio since 1970 is shown in the second chart to the right. Gurufocus.com calculates and updates this ratio daily. As of 02/17/2020, this ratio is 158.1%.
We can see that, during the past four decades, the TMC/GNP ratio has varied within a very wide range. The lowest point was about 35% in the previous deep recession of 1982, while the highest point was 148% during the tech bubble in 2000. The market went from extremely undervalued in 1982 to extremely overvalued in 2000.
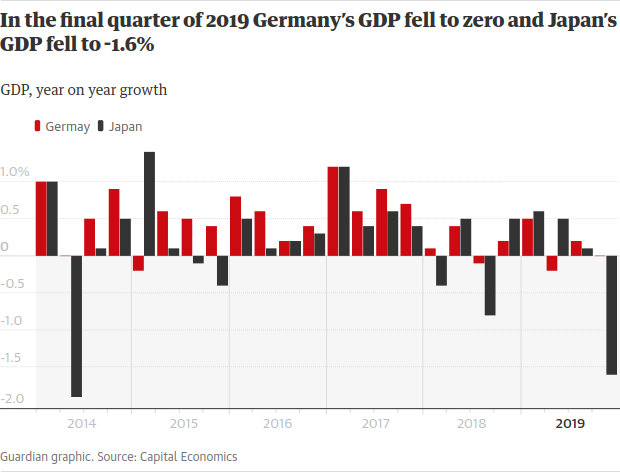
So that’s the third (Japan) and fourth (Germany) biggest economies in the world flirting with recession coming into 2020.
— Jonathan Ferro (@FerroTV) February 17, 2020
Serious lack of momentum given what is happening in China. https://t.co/TJ9UzZDOrP pic.twitter.com/okia60rzhE
Grim Q4 GDP print for Japan: 6.3% contraction annualised. Tax hike, weather, China showdown to blame. Coronavirus augurs ill for Q1. Even with a recovery in H2, bad end to 2019, poor start to 2020 suggest Japan’s full-yr 2020 GDP will flatline at best, probably shrink. Asahi pic pic.twitter.com/MZbkOkM5sv
— Robert Ward (@RobertAlanWard) February 17, 2020
![]()
this is not financial advice
*I also have no idea what I’m talking about

I’m not sure I understand Ray Dalio’s points here, I think the crux of it is this:
The currently ongoing QE (central banks printing money) and the increase in it likely to occur in the event of an economic downturn would make trying to “cash out” investments and ride out the storm difficult since
More money printed -> your money less valuable -> cash = trash
In addition, holding bonds might not make as much sense because there’s not as much of a guarantee that their face value (what they cash out to be) will be worth as much in the event of significant QE
Hence the advocating for diversified investments as value stores that would be good growth investments and resistant to currency devaluation
fred.stlouisfed.org/series/WALCL
Edit 2020-03-06: The fed has said anounced it is going to print “whatever it takes” to keep the economy moving. Where, or if there would even be sensible limits on this QE is unclear.
With that in mind, left as a fun exercise for the reader: watch this graph for the next 6 months:
linkedin.com/pulse/world-has-gone-mad-system-broken-ray-dalio
federalreserve.gov/monetarypolicy/2020-02-mpr-summary.htm
Monetary Policy
Interest rate policy.
In light of the implications of global developments for the economic outlook as well as muted inflation pressures, the FOMC lowered the target range for the federal funds rate over the second half of 2019. Specifically, at its July, September, and October meetings, the FOMC lowered the target range a cumulative 75 basis points, bringing it to the current range of 1½ to 1¾ percent. In its subsequent meetings, the Committee judged that the prevailing stance of monetary policy was appropriate to support sustained expansion of economic activity, strong labor market conditions, and inflation returning to the Committee’s symmetric 2 percent objective. The Committee noted that it will continue to monitor the implications of incoming information for the economic outlook as it assesses the appropriate path of the target range for the federal funds rate.
Financial stability.
The U.S. financial system is substantially more resilient than it was before the financial crisis. Leverage in the financial sector appears low relative to historical norms. Total household debt has grown at a slower pace than economic activity over the past decade, in part reflecting that mortgage credit has remained tight for borrowers with low credit scores, undocumented income, or high debt-to-income ratios. In contrast, the levels of business debt continue to be elevated compared with the levels of either business assets or GDP, with the riskiest firms accounting for most of the increase in debt in recent years (+). While overall liquidity and maturity mismatches and funding risks in the financial system remain low, the volatility in repurchase agreement (repo) markets in mid-September 2019 highlighted the possibility for frictions in repo markets to spill over to other markets. Finally, asset valuations are elevated and have risen since July 2019, as investor risk appetite appears to have increased. (See the box “Developments Related to Financial Stability” in Part 1.)
Framework review and Fed Listens events.
In 2019, the Federal Reserve System began a broad review of the monetary policy strategy, tools, and communication practices it uses to pursue its statutory dual-mandate goals of maximum employment and price stability. The Federal Reserve sees this review as particularly important at this time because the U.S. economy appears to have changed in ways that matter for monetary policy. For example, the neutral level of the policy interest rate appears to have fallen in the United States and abroad, increasing the risk that the effective lower bound on interest rates will constrain central banks from reducing their policy interest rates enough to effectively support economic activity during downturns. The review is considering what monetary policy strategy will best enable the Federal Reserve to meet its dual mandate in the future, whether the existing monetary policy tools are sufficient
Monetary policy rules.
Prescriptions for the policy interest rate from monetary policy rules often depend on judgments and assumptions about economic variables that are inherently uncertain and may change over time. Notably, many policy rules depend on estimates of resource slack and of the longer-run neutral real interest rate, both of which are not directly observable and are estimated with a high degree of uncertainty. As a result, the amount of policy accommodation that these rules prescribe—and whether that amount is appropriate in light of underlying economic conditions—is also uncertain. Such a situation cautions against mechanically following the prescriptions of any specific rule. (See the box “Monetary Policy Rules and Uncertainty in Monetary Policy Settings” in Part 2.)
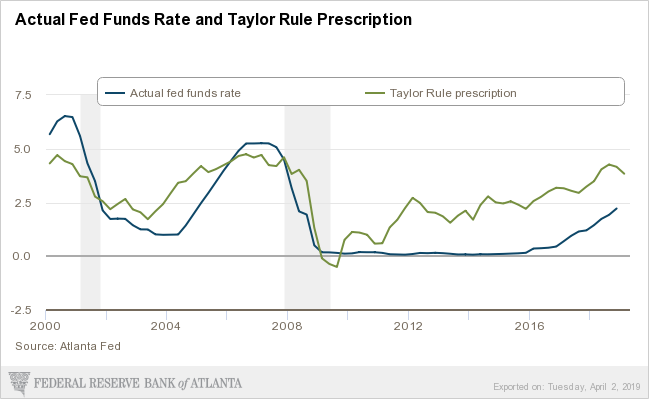
linkedin.com/pulse/three-key-takeaways-from-feds-monetary-policy-report-kristina-hooper/
Takeaway No. 2: Rules are meant to be broken
Another special topic in the Monetary Policy Report focused on monetary policy rules and their role in times of uncertainty. The Fed provided a brief background of these rules — for example, the Taylor rule, which suggests that the Fed should raise interest rates when inflation and employment are high, and cut rates when inflation and employment levels are low.
The Fed recognized that the policy prescriptions derived from these monetary policy rules are dependent on factors such as the longer-run neutral real interest rate, which can change (likely moving lower). The key takeaway from this exploration is that the Fed does not want to rely on rules-based monetary policy when there is uncertainty around key assumptions that impact the rules. This stance supports what the Fed did last year in terms of providing three “insurance” rate cuts that weren’t called for based on a strict mechanical adherence to these rules.

![]()
The desert sessions 11 & 12

I’m a big fan of Josh Homme’s work.
Famously, he started a punk band named Kyuss as a teen in the early nineties in Palm Desert California, pioneering a sound style of long, rythmic, heavy guitar riffs that would spark the creation of the wider stoner rock genre.
He’s most famous though from his involvement in his band Queens of the Stone Age, where he was able to take his experimental sound style from Kyuss and refine it into a series of excellently produced albums.
He’s also done some great production work for other bands too, including his heavy involvement with the Eagles of Death Metal and his production of one-off albums for bands like the Arctic Monkeys and CRX. He has a great way of adapting his signature sound to whomever he works with.
Definitely a case of respect the art, not the artist though. (He did apologise at least)
but ultimately, if you’re looking for rock n’ roll you’re likely not looking for a saint, and by all means Homme’s the guy to do the rocking and the rolling.
He’s still kept coming back to the Palm Desert in California later in his career, often bringing assorted artists with him to experiment with new sounds. Many of these experiments have been released in a series named the desert sessions and were foundations for songs for QOTSA albums.
He’s recently created yet another set of “experimental” desert sessions 11 and 12, they may be worth a listen.
![]()
The heartbleed OpenSSL vulnerability in 2014 (effecting Google, Facebook, etc.) exposed another issue: sometimes widely used open source software doesn’t get the love it deserves in terms of monetary and/or code support from those that use it.
If you’re using open source software at your company, then this software could be considered in economics terms as a “complement” to your company’s product, where its availability, quality, and ecosystem directly bolsters it.
Here, Joel Spolsky writes on how smart companies in the past have strategized to further their business interests by supporting and proliferating complements to their products, or otherwise “commoditizing their complements” to great results
The success of open source continues to grow; surveys show that the majority of companies use some form of open source, 99% of enterprises see open source as important, and almost half of developers are contributing back.
It’s important to note that companies aren’t contributing to open source for purely altruistic reasons. Recent research from Harvard shows that open source-contributing companies capture up to 100% more productive value from open source than companies that do not contribute back.
Thus, in the spirit of software is eating the world and “oops, I guess pretty much every company is a tech company now” (+), TheNewStack.io has released an interesting set of info-graphics on open source usage and contribution rates across various industries:

![]()